aka Zombie’s software eye logo.

See the Pen
Faux sphere render + interactive lighting
by Hristo G. (@izo0x90)
on CodePen.

Quick and dirty lighted “sphere” likeness using circle radius calculation for the color intensity value. We shift the “lighting” around by adding/subtracting to the color intensity amount of a pixel on the “sphere”, this amount is based on the current x, y position of the pixel multiplied by horizontal and vertical constants. Those are modulated by the current mouse x, y mouse cursor position as percentage of the inner window dimensions. The green/zombie’s “eye” was a logo that I used when branding the games/ graphics demos, etc. that I would write way back when in the ’90s.


This is a Raycaster I created from scratch,written in Javascript that uses an unconventional algorithm I came up with. It was a fun exercise in thinking, starting at trigonometry and coding an algorithm that worked. Once I finish up a few more details in the code I will put up blog post here describing things in more detail. For now you can click the link below and play around with the raycaster engine, a very very un-optimized, zero error checking raycaster engine, but in the words of Boltr, “She chooches!”

RaycasterTestV01 Click here to launch!

Here is an example of an expert system for decision making coded in SWI-Prolog.

It takes a sample portfolio, a current asset price list and a risk tolerance profile it can then make decisions regrading selling financial assets based on specific strategy being applied.

These strategies are based on predefined tactics, and the tactics in turn are an application of lists of sell rules.

This an exercise in declarative logic programming, please DO NOT TAKE ANY OF THIS AS INVESTMENT ADVICE.

Currently only some sell rules, tactics and a strategy are implemented, this framework can however be easily extended to encompass a full spectrum trading decision making.

At some point in time I will also extend this post to further describe and document this code.  For now you can just head over to https://swish.swi-prolog.org/  paste the code in the online IDE and take it for a spin.

Continue reading

Here is some of the work that we have done in a signal processing class CSC214 I was sitting in on during spring semester 2018, held at MCC, Rochester NY and instructed by D. Venable.

I helped with some of the software development for the creation of the first iteration of this class a long while ago, now years later it has been fully revamped.

The students now take hands on approach with both the hardware and software development. Unlike previews iterations where software was built by me and the instructor who originated the class and hardware was designed and built by the instructor. The old curriculum involved them experimenting and exploring this pre-built system, while in the new curriculum students are active part in all aspects of camera development, including embedded on camera and pc client software, case and mechanics design and building, circuit board layout and population, etc. Continue reading

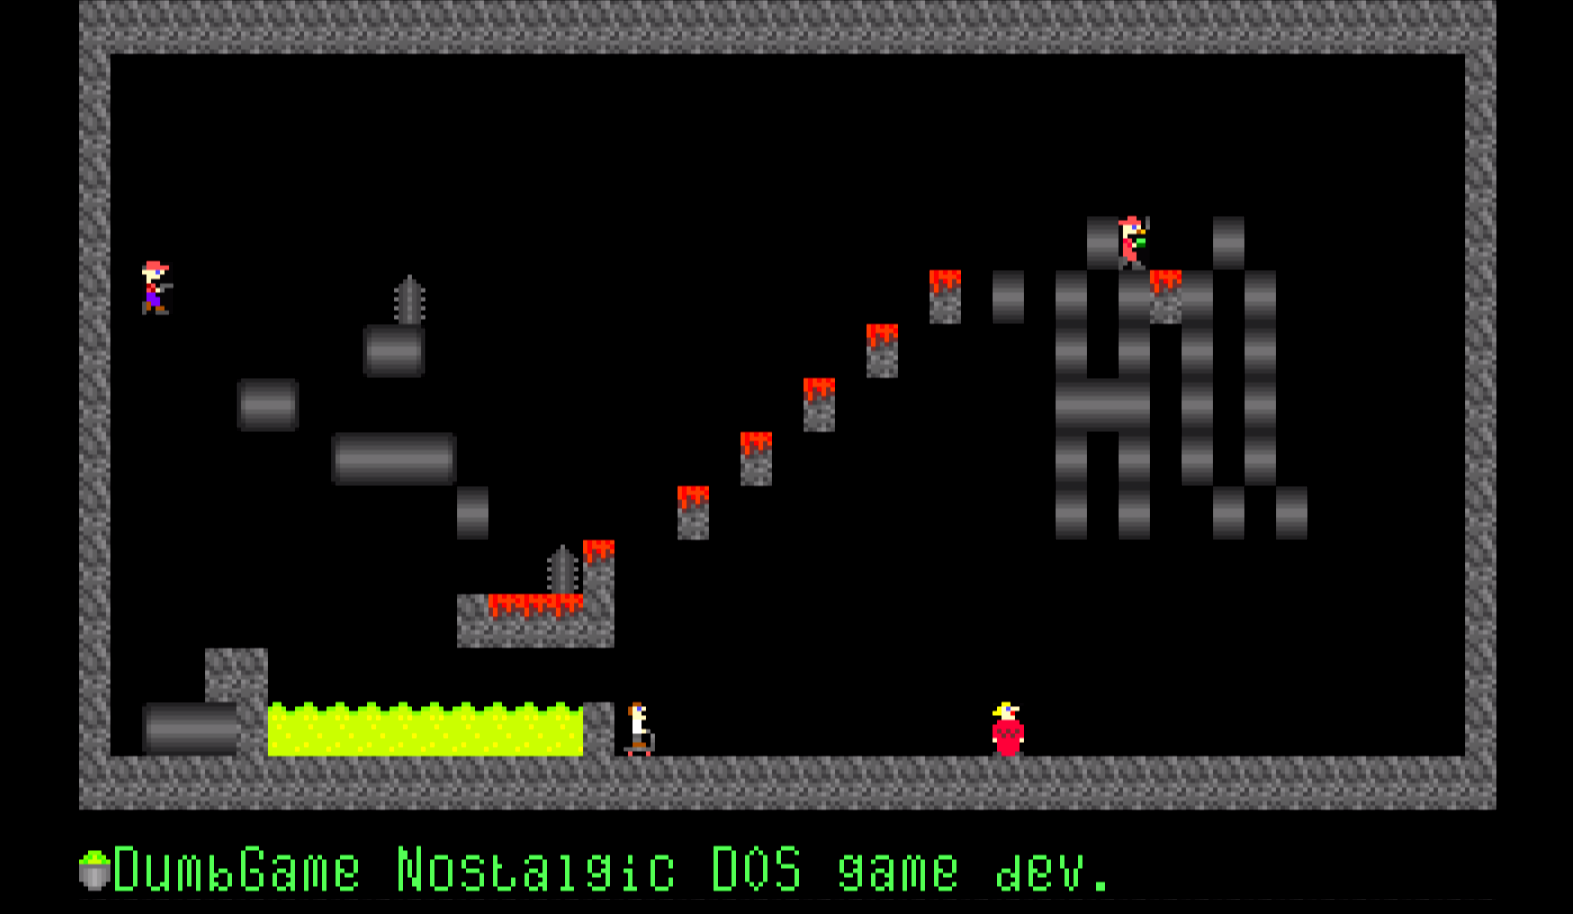
DumbGame is a video game I wrote in 2002 intended to serve as somewhat of a tutorial or map of how games were developed in years past, on the  80×86 architecture under DOS (Disk Operating System). Going through an old laptop hard-drive I recently rediscovered its source code, finally making an appearance on the Internet as intended, even more appropriate and nostalgic this many more years later.

Its name sake is due to the fact that the actual game play, graphics, levels etc. were minimally developed only to the extent needed to showcase the functionality of the game engine.

DumbGame_screenshot

Continue reading

This is a basic Twitter data miner written in Python. It utilizes the Twython, Pandas, Numpy, Matplotlib, Re, Textblob libraries to extract and analyze Twitter data based on a specific search query.

By collecting and organizing the data by chosen time period we are able to visualize the frequency of use of the search term per period as well as assign a positive or negative sentiment to the period based on natural language processing analysis.

We are also able to gain some suggestion as to the rising or falling popularity of the search term by fitting a regression line across the periods, where the slope of the line can suggest an accelerating or decelerating trend.

We are also able to aggregate a list of related hashtags that are used along with the search query.

Since this simple data miner utilizes the Twitter standard search API we are limited to 7 days of historic data and completeness is not guaranteed, it is enough for us to build an example that illustrates the possibilities available by mining public opinion through the medium of Twitter.

Twitter data miner article art Continue reading